
こんにちは、虎の穴ラボの山田です。
この記事は「虎の穴ラボ夏のアドベントカレンダー」19日目の記事です。
18日目は野田さんによる「Golangで画像に透かしを挿入するCLIツールの作成 」が投稿されました。
20日目はサカガミさんによる「VSCodeの拡張機能を作成する」が投稿されます。こちらもぜひご覧ください。
本ブログは、最近触りはじめた監視ツールPrometheusで、習熟も兼ねてエクスポーターを作成し、AWSのコスト状況の監視を試すというものになります。
以前AWSの自前環境で、NATを作成してしばらく置いておいたら思わぬ請求を受けたことがあります。
それ以来コストのかさむリソースの作成には気をつけているのですが、やはりコストは気にかかるものです。
そんな中、監視ツールのPrometheusを触りはじめてエクスポーターの試作を考えるようになりました。
それならAWSのAPIを呼び出してコスト状況の監視を行えないか?と思いついたのが、本ブログを書くきっかけです。
本ブログではPrometheusの説明やアラートマネージャーの設定、Grafanaによる表示などについては説明を割愛しています。どうかご了承ください。
やること
- AWSコストエクスプローラーAPIの動作テスト
- エクスポーターの作成とテスト
- Prometheusを設定して動作確認
環境
- macOS Catalina バージョン 10.15.7
- aws-cli バージョン 2.7.16
- go バージョン 1.18.4
また前提として、AWS CLIにより対象環境のコストエクスプローラーにアクセスが可能になっている必要があります。
AWSコストエクスプローラーAPIの動作テスト
まずはAWS CLIを使ってAWSの今月のコスト状況を取得してみます。 対象環境が自前のものとなるため、ここでは「my-account」という名前付きプロファイルを事前に作成し、それを指定して実行しています。
$ aws ce --profile my-account get-cost-and-usage \
--region us-east-1 \
--time-period Start=`date +'%Y-%m-01'`,End=`date +'%Y-%m-%d'` \
--granularity MONTHLY \
--metrics BlendedCost \
--group-by Type=DIMENSION,Key=SERVICE
簡単にここで指定したパラメータについて説明をしておきます。
- --region : 対象リージョンを指定します。コストエクスプローラー関連のコマンドを実行する際は「us-east-1」を指定してください。
- --time-period : 対象期間を指定します。期間はStart以降とEnd未満の月日が対象となるため、「Start=2021-02-01,End=2021-03-01」と指定した場合は「2021-03-01」は対象期間に含まれません。
- --granularity : 取得するコストの粒度を指定します。ここでは月単位での取得を意味するMONTHLYを指定しています。
- --metrics : 返されるメトリックの値について指定します。ここではBlendedCostを指定しています。
- --group-by : どのような単位で値を取得するかを指定します。「アカウントごと」「サービスごと」といった指定が可能です。
詳しくはこちらの公式ページをご参照下さい。
ここで指定したパラメータは、これ以降APIを呼び出す際にも同様の指定をします。
上記のコマンドを実行すると、以下のようなレスポンスが返ります。
{
    "GroupDefinitions": [
        {
            "Type": "DIMENSION",
            "Key": "SERVICE"
        }
    ],
    "ResultsByTime": [
        {
            "TimePeriod": {
                "Start": "2022-07-01",
                "End": "2022-07-19"
            },
            "Total": {},
            "Groups": [
                {
                    "Keys": [
                        "AWS Key Management Service"
                    ],
                    "Metrics": {
                        "BlendedCost": {
                            "Amount": "0",
                            "Unit": "USD"
                        }
                    }
                },
(中略)
                {
                    "Keys": [
                        "Tax"
                    ],
                    "Metrics": {
                        "BlendedCost": {
                            "Amount": "0.05",
                            "Unit": "USD"
                        }
                    }
                }
            ],
            "Estimated": true
        }
    ],
    "DimensionValueAttributes": []
}
次にAWS CLIで試したコマンドをAPIで呼び出してみます。
ここではGoで実装したもので試してみます。
NOTE:
コストエクスプローラー関連のAPIは、1リクエストごとに 0.01 USDの料金が発生します。(2022年07月19日時点)
検証などで何度も実行する際は注意してください。
環境を作成したら、まずはパッケージをインストールしておきます。
$ go get github.com/aws/aws-sdk-go/aws
$ go get github.com/aws/aws-sdk-go/service/costexplorer
パッケージのインストール後は、以下のようなGoのファイルを作成します。
package main

import (
    "fmt"
    "time"

    "github.com/aws/aws-sdk-go/aws"
    "github.com/aws/aws-sdk-go/aws/session"
    "github.com/aws/aws-sdk-go/service/costexplorer"
    "github.com/aws/aws-sdk-go/service/costexplorer/costexploreriface"
)

func GetCost(svc costexploreriface.CostExplorerAPI) (result *costexplorer.GetCostAndUsageOutput) {

    // TimePeriod
    now := time.Now()
    startDate := time.Date(now.Year(), now.Month(), 1, 0, 0, 0, 0, time.UTC).Format("2006-01-02")
    endDate := now.Format("2006-01-02")

    timePeriod := costexplorer.DateInterval{
        Start: aws.String(startDate),
        End:   aws.String(endDate),
    }

    // Granularity
    granularity := aws.String("MONTHLY")

    // Metrics
    metric := "BlendedCost"
    metrics := []*string{&metric}

    // GroupBy
    group := costexplorer.GroupDefinition{
        Type: aws.String("DIMENSION"),
        Key:  aws.String("SERVICE"),
    }
    groups := []*costexplorer.GroupDefinition{&group}

    input := costexplorer.GetCostAndUsageInput{}
    input.TimePeriod = &timePeriod
    input.Granularity = granularity
    input.Metrics = metrics
    input.GroupBy = groups

    result, err := svc.GetCostAndUsage(&input)
    if err != nil {
        fmt.Println(err.Error())
    }

    return result
}

func main() {
    profile_name := "my-account"
    sess := session.Must(session.NewSessionWithOptions(session.Options{
        Profile: profile_name,
    }))
    svc := costexplorer.New(sess)
    cost := GetCost(svc)
    fmt.Println(cost)
}
実行すると以下のようなレスポンスの内容が表示されます。
{
  DimensionValueAttributes: [],
  GroupDefinitions: [{
      Key: "SERVICE",
      Type: "DIMENSION"
    }],
  ResultsByTime: [{
      Estimated: true,
      Groups: [
        {
          Keys: ["AWS Key Management Service"],
          Metrics: {
            BlendedCost: {
              Amount: "0",
              Unit: "USD"
            }
          }
        },
(中略)
        {
          Keys: ["Tax"],
          Metrics: {
            BlendedCost: {
              Amount: "0.05",
              Unit: "USD"
            }
          }
        }
      ],
      TimePeriod: {
        End: "2022-07-19",
        Start: "2022-07-01"
      },
      Total: {

      }
    }]
}
先ほどのAWS CLIでの結果とほぼ同じ結果になっています。
このままだと扱いづらいので、先ほどのコードの最後の部分だけを修正して扱いやすくしておきます。
// 先ほどのコードのmain()だけを以下のように修正します。
func main() {
    profile_name := "my-account"
    sess := session.Must(session.NewSessionWithOptions(session.Options{
        Profile: profile_name,
    }))
    svc := costexplorer.New(sess)
    cost := GetCost(svc)
    // fmt.Println(cost)
    // パースして、キーとなる文字列とコストだけを抽出して表示します。
    for _, group := range cost.ResultsByTime[0].Groups {
        amount, err := strconv.ParseFloat(*group.Metrics["BlendedCost"].Amount, 64)
        if err != nil {
            fmt.Println(err.Error())
        }
        val := fmt.Sprintf("- %s: %f USD", *group.Keys[0], amount)
        fmt.Println(val)
    }
}
これを実行すると以下のような形でレスポンスの内容が表示されます。
- AWS Key Management Service: 0.000000 USD
- EC2 - Other: 0.390963 USD
- Amazon Elastic Compute Cloud - Compute: 0.158451 USD
- Amazon Simple Storage Service: 0.000009 USD
- AmazonCloudWatch: 0.000000 USD
- Tax: 0.050000 USD
エクスポーターの作成とテスト
ここまででAWSコストエクスプローラーAPIの動作確認が取れました。
次にPrometheusのエクスポーターを作成していきます。
まずは公式が公開しているGoのサンプルを少し修正したもので動作確認を行ってみます。
先ほどと同じように、まずはパッケージをインストールしておきます。
$ go get github.com/prometheus/client_golang/prometheus
インストール後はコードを作成します。
package main

import (
    "log"
    "net/http"

    "github.com/prometheus/client_golang/prometheus"
    "github.com/prometheus/client_golang/prometheus/promhttp"
)

var (
    awsCost = prometheus.NewGaugeVec(prometheus.GaugeOpts{
        Name: "my_aws_cost_for_this_month",
        Help: "My AWS cost for this month.",
    },
        []string{
            "key",
        },
    )
)

func init() {
    // Metrics have to be registered to be exposed:
    prometheus.MustRegister(awsCost)
}

func main() {
    awsCost.With(prometheus.Labels{"key": "Tax"}).Set(0.05)

    http.Handle("/metrics", promhttp.Handler())
    log.Fatal(http.ListenAndServe(":8080", nil))
}
上記のコードを実行すると待ち状態になるので curlコマンドでアクセスしてみます。
すると、以下のようなPrometheusのエクスポーターが返す文字列が出力され、その中にコードで設定した値が確認できます。
$ curl http://localhost:8080/metrics
・・・
# HELP my_aws_cost_for_this_month My AWS cost for this month.
# TYPE my_aws_cost_for_this_month gauge
my_aws_cost_for_this_month{key="Tax"} 0.05
・・・
このコードに、先ほどのAPIを呼び出すコードを組み合わせます。
package main

import (
    "fmt"
    "log"
    "net/http"
    "strconv"
    "time"

    "github.com/aws/aws-sdk-go/aws"
    "github.com/aws/aws-sdk-go/aws/session"
    "github.com/aws/aws-sdk-go/service/costexplorer"
    "github.com/aws/aws-sdk-go/service/costexplorer/costexploreriface"
    "github.com/prometheus/client_golang/prometheus"
    "github.com/prometheus/client_golang/prometheus/promhttp"
)

var (
    awsCost = prometheus.NewGaugeVec(prometheus.GaugeOpts{
        Name: "aws_cost_to_date",
        Help: "AWS costs to date.",
    },
        []string{
            "key",
        },
    )
)

func init() {
    // Metrics have to be registered to be exposed:
    prometheus.MustRegister(awsCost)
}

func GetCost(svc costexploreriface.CostExplorerAPI) (result *costexplorer.GetCostAndUsageOutput) {

    // TimePeriod
    now := time.Now()
    startDate := time.Date(now.Year(), now.Month(), 1, 0, 0, 0, 0, time.UTC).Format("2006-01-02")
    endDate := now.Format("2006-01-02")

    timePeriod := costexplorer.DateInterval{
        Start: aws.String(startDate),
        End:   aws.String(endDate),
    }

    // Granularity
    granularity := aws.String("MONTHLY")

    // Metrics
    metric := "BlendedCost"
    metrics := []*string{&metric}

    // GroupBy
    group := costexplorer.GroupDefinition{
        Type: aws.String("DIMENSION"),
        Key:  aws.String("SERVICE"),
    }
    groups := []*costexplorer.GroupDefinition{&group}

    input := costexplorer.GetCostAndUsageInput{}
    input.TimePeriod = &timePeriod
    input.Granularity = granularity
    input.Metrics = metrics
    input.GroupBy = groups

    result, err := svc.GetCostAndUsage(&input)
    if err != nil {
        fmt.Println(err.Error())
    }

    return result
}

// 86,400秒ごとにAWSからコストを取得してメトリクスをセットします。
func setMetrics() {
    for {
        profile_name := "my-account"
        sess := session.Must(session.NewSessionWithOptions(session.Options{
            Profile: profile_name,
        }))
        svc := costexplorer.New(sess)
        cost := GetCost(svc)
        for _, group := range cost.ResultsByTime[0].Groups {
            amount, err := strconv.ParseFloat(*group.Metrics["BlendedCost"].Amount, 64)
            if err != nil {
                fmt.Println(err.Error())
            }
            awsCost.With(prometheus.Labels{"key": *group.Keys[0]}).Set(amount)
        }

        time.Sleep(86400 * time.Second)
    }
}

func main() {
    go setMetrics()

    http.Handle("/metrics", promhttp.Handler())
    log.Fatal(http.ListenAndServe(":8080", nil))
}
先ほどと同様にcurlコマンドで確認を行うと、APIを呼び出した際に取得していた値が確認できます。
$ curl http://localhost:8080/metrics
・・・
# HELP aws_cost_to_date AWS costs to date.
# TYPE aws_cost_to_date gauge
aws_cost_to_date{key="AWS Key Management Service"} 0
aws_cost_to_date{key="Amazon Elastic Compute Cloud - Compute"} 0.1584508896
aws_cost_to_date{key="Amazon Simple Storage Service"} 8.6346e-06
aws_cost_to_date{key="AmazonCloudWatch"} 0
aws_cost_to_date{key="EC2 - Other"} 0.3909634614
aws_cost_to_date{key="Tax"} 0.05
・・・
Prometheusを設定して動作確認
最後にPrometheusからアクセスを行い、動作を確認します。
今回はあくまで動作確認のため、これも手元のPCで実行します。
GitHubで公開されているPrometheusをダウンロードし、展開後に設定ファイルを修正して起動します。
(先ほどの自作したエクスポーターは起動しておいて下さい)
$ wget https://github.com/prometheus/prometheus/releases/download/v2.37.0/prometheus-2.37.0.darwin-amd64.tar.gz
$ tar xvfz prometheus-2.37.0.darwin-amd64.tar.gz
$ cd prometheus-2.37.0.darwin-amd64
$ vi prometheus.yml
prometheus.ymlファイルを開き、scrape_configs:の部分を以下のように修正します。
scrape_configs:
  - job_name: "prometheus"
    static_configs:
      - targets: ["localhost:9090"]
  - job_name: "aws_cost_exporter"
    static_configs:
      - targets: ["localhost:8080"]
修正後はファイルを閉じ、Prometheusを起動します。
$ ./prometheus
起動を確認したらブラウザで http://localhost:9090/ にアクセスし、Targetsの表示状況を確認します。
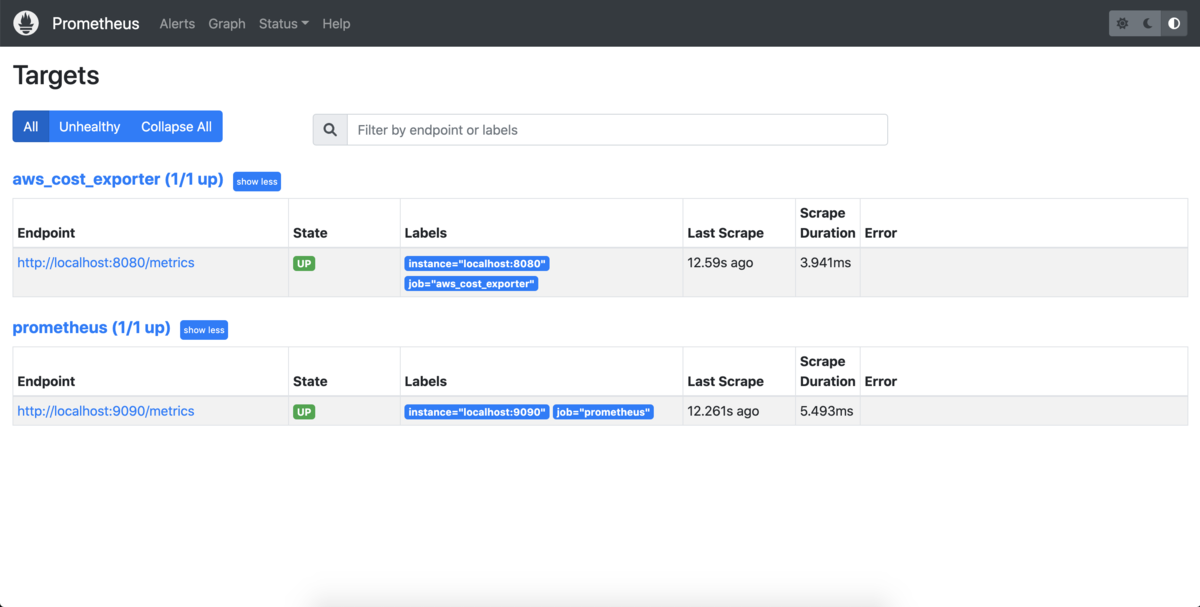
自作したエクスポーターにアクセスできているのが確認できたので、次にGraph画面で値が取れているか確認します。
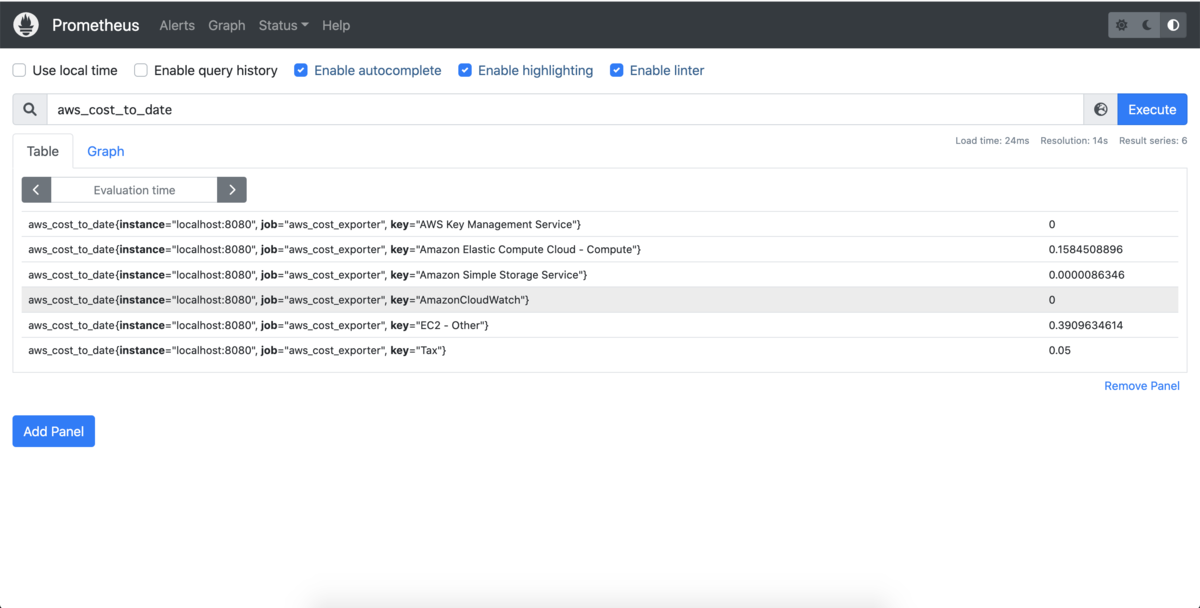
こちらも値の確認ができました。これで動作確認は完了です。
終わりに
最近は自前環境構築をTerraformで行い、作業後は削除するようにしています。
そのため以前ほどコストを気にするようなことも無くなったのですが、業務となると異なります。
今回は簡単な動作確認ができる程度のものとなってしまいましたが、いずれは業務の利用に応えられるようなエクスポーターを自作したいと考えています。
P.S.
虎の穴ラボでは、私たちと一緒に新しいオタク向けサービスを作る仲間を募集しています。
詳しい採用情報は以下をご覧ください。
